By: Jeremi Karnell, CEO
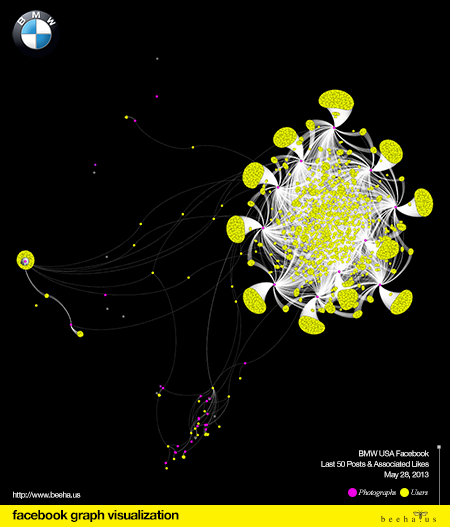
Last week, I introduced our new series titled “Facebook Graph Visualization“. Every week we will pick a major brand and visualize their last 50 posts by type and associated likes by user. Last week we chose Pepsi. This week our efforts are focused on BMW USA.
The graph represents 7,491 nodes and 11,905 edges. We used Force Atlas to assist with cleaning up the image (for this particular graph, it took over an hour before we started seeing recognizable groupings). What I think is interesting about this image is how it demonstrates that 11 of the last 50 Facebook post made by BMW USA drew the most likes. Moreover, it reveals BMW’s strategy to really leverage photography as their primary story telling device.
Contact Us Today to learn how Graph Marketing can help your business engage your customers in meaningful ways that produce real results.


Pingback: 2013-06-02 08-16-28 NodeXL Twitter Search #dataviz | Virtual Economy
Pingback: 2013-06-02 08-16-28 NodeXL Twitter Search #dataviz
Pingback: Facebook Graph Visualization: MTV - Beehaus
Pingback: Facebook Graph Visualization: American Express - Beehaus - Beehaus
Pingback: Facebook Graph Visualization: Golf Digest - Beehaus