
By: Jeremi Karnell, CEO
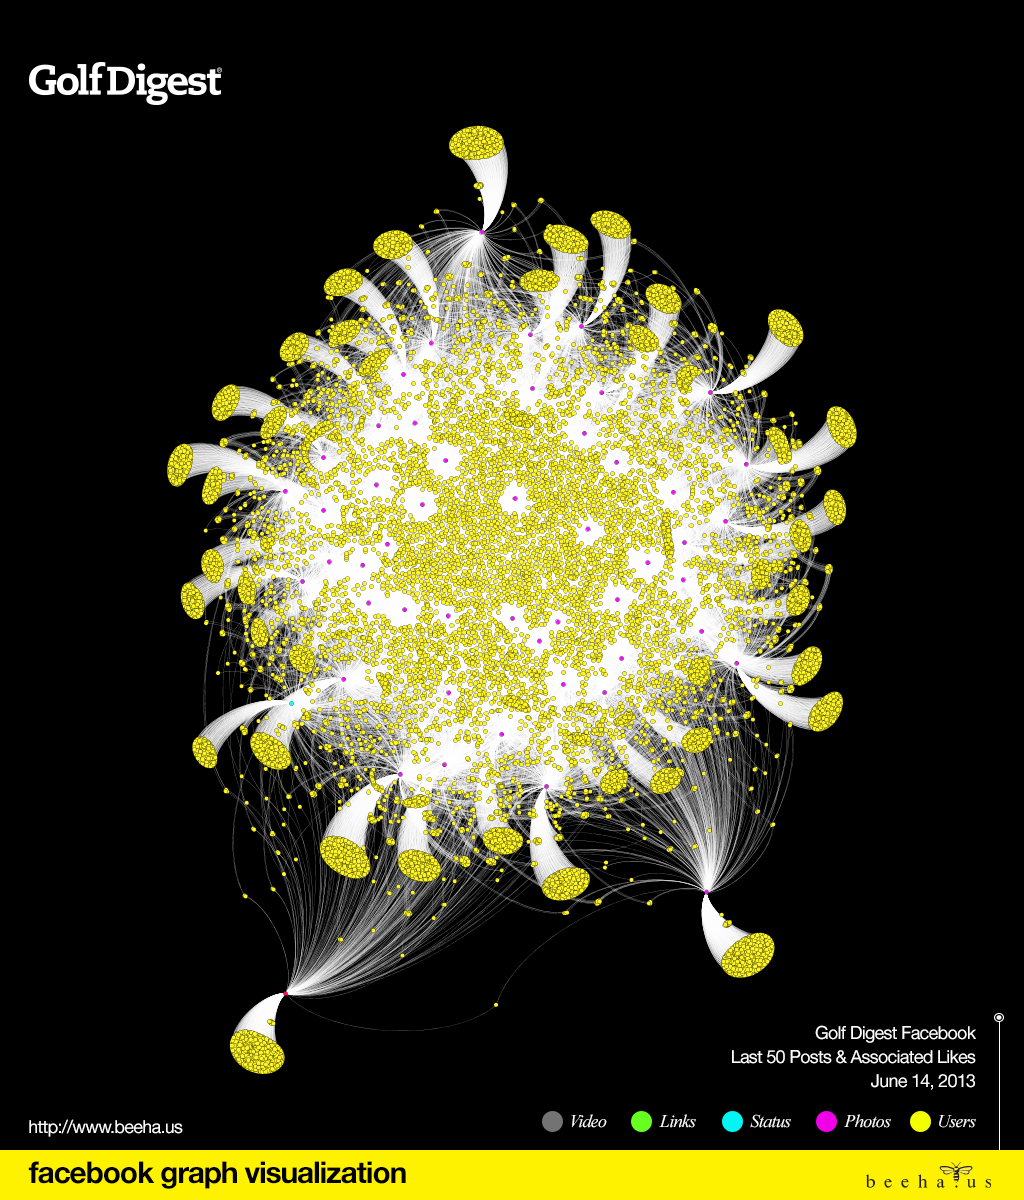
In celebration of the US Open, this week’s Facebook graph visualization exercise focused on Golf Digest Magazine. Analyzing the last 50 Facebook posts and corresponding likes, beehaus generated an interesting view of how Golf Digest’s community engages with their content. The below graph represents 21,961 nodes and 50,453 edges.
Check out our past Facebook graph visualizations:
Contact Us Today to learn how Graph Marketing can help your business engage your customers in meaningful ways that produce real results.
Pingback: Facebook Graph Visualization: MTV - Beehaus