By: Jeremi Karnell, CEO
For the last several weeks, I have been defining Graph Marketing and discussing corresponding strategies and tactics. In those posts, I have consistently stated that big data, data science, and data visualization were an important part of getting Graph Marketing right.
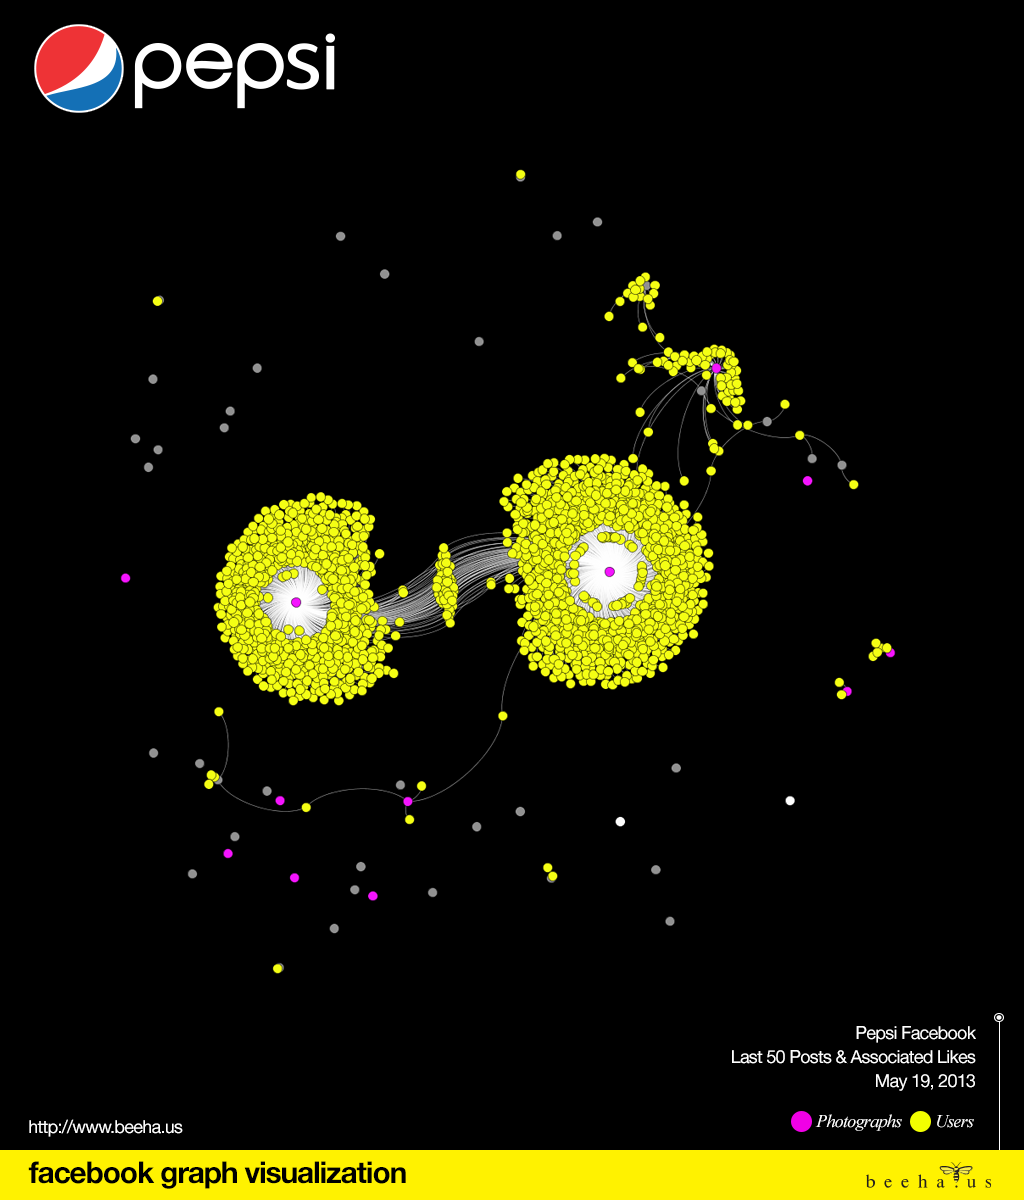
To help illustrate this point, we would like to introduce the first of what will be a weekly series titled Facebook Graph Visualization. This collection will visualize the data of 50 posts and the corresponding user engagement for a major brand’s Facebook Page. We are collecting data from Netvizz and compiling it through Gephi.
I decided to select Pepsi as our first brand to visualize. As you can see in the image, provided below, there were two major clusters that represent Pepsi posts that garnered the most user engagement in their last 50 posts. These posts were both photos. The cluster on the left was a post highlighting the latest behind the scenes interview with Beyoncé’s stylist, Ty Hunter. The cluster on the right (which received the most amount of Likes, Comments, and Shares) was simply a photo of a Pepsi branded bicycle. Bikes over Beyoncé…now that is an interesting result.
Contact Us Today to learn how Graph Marketing can help your business engage your customers in meaningful ways that produce real results.
Pingback: Facebook Graph Visualization: BMW USA - Beehaus - Beehaus
Pingback: Facebook Graph Visualization: American Express - Beehaus - Beehaus
Pingback: Converse Facebook Graph Visualization - beehaus - Beehaus
Pingback: Facebook Graph Visualization: MTV - Beehaus